Back Home
Persistent Timer

Combinations Graphs

Q.No: 1
Test Name : CAT Paper 2008
Directions for Questions 29 to 31: Answer the following questions based on the information given below:

Telecom operators get revenue from transfer of data and voice. Average revenue received from transfer of each unit of data is known as ARDT. In the diagram below, the revenue received form data transfer as percentage of total revenue received and the ARDT in US Dollars (USD) are given for various countries

It was found that the volume of data transfer in India is the same as that of Singapore. Then which of the following statements is true?

A
Total revenue is the same in both countries.
B
Total revenue in India is about 2 times that of Singapore.
C
Total revenue in India is about 4 times that of Singapore.
D
Total revenue in Singapore is about 2 times that of India.
E
Total revenue in Singapore is about 4 time that of India.
Solution:
Q.No: 2
Test Name : CAT Paper 2008
Directions for Questions 29 to 31: Answer the following questions based on the information given below:

Telecom operators get revenue from transfer of data and voice. Average revenue received from transfer of each unit of data is known as ARDT. In the diagram below, the revenue received form data transfer as percentage of total revenue received and the ARDT in US Dollars (USD) are given for various countries

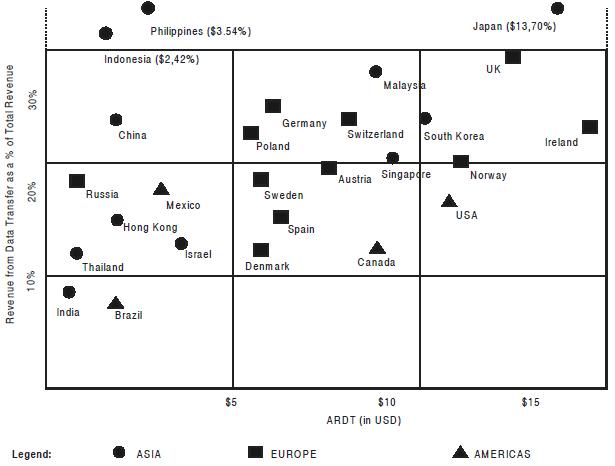
It is expected that by 2010, revenue from data transfer as a percentage of total revenue will triple for India and double for Sweden. Assume that in 2010, the total revenue in India is twice that of Sweden and that the volume of data transfer is the same in both the countries. What is the percentage increase of ARDT in India if there is no change in ARDT in Sweden?

A
400%
B
550%
C
800%
D
950%
E
cannot be determined
Solution:
Q.No: 3
Test Name : CAT Paper 2008
Directions for Questions 29 to 31: Answer the following questions based on the information given below:

Telecom operators get revenue from transfer of data and voice. Average revenue received from transfer of each unit of data is known as ARDT. In the diagram below, the revenue received form data transfer as percentage of total revenue received and the ARDT in US Dollars (USD) are given for various countries

If the total revenue received is the same for the pairs of countries listed in the choices below, choose the pair that has approximately the same volume of data transfer.

A
Philippines and Austria
B
Canada and Poland
C
Germany and USA
D
UK and Spain
E
Denmark and Mexico
Solution:
Q.No: 4
Test Name : CAT Paper 1996
Direction for questions 171 to 175: Answer the questions based on the following information.
The first table gives the percentage of students in MBA class, who sought employment in the areas of finance, marketing and software. The second table gives the average starting salaries of the students per month, (rupees in thousands) in these areas. The third table gives the number of students who passed out in each year.

The number of students who get jobs in finance is less than the students getting marketing jobs, in the 5 years, by

A
826
B
650
C
750
D
548
Solution:
Q.No: 5
Test Name : CAT Paper 1996
Direction for questions 171 to 175: Answer the questions based on the following information.
The first table gives the percentage of students in MBA class, who sought employment in the areas of finance, marketing and software. The second table gives the average starting salaries of the students per month, (rupees in thousands) in these areas. The third table gives the number of students who passed out in each year.

What is the percentage increase in the average salary of finance from 1992 to 1996?

A
60%
B
32%
C
96%
D
80%
Solution:
Q.No: 6
Test Name : CAT Paper 1996
Direction for questions 171 to 175: Answer the questions based on the following information.
The first table gives the percentage of students in MBA class, who sought employment in the areas of finance, marketing and software. The second table gives the average starting salaries of the students per month, (rupees in thousands) in these areas. The third table gives the number of students who passed out in each year.

The average annual rate at which the initial salary offered in software increases is

A
21%
B
33%
C
15.9%
D
65%
Solution:
Q.No: 7
Test Name : CAT Paper 1996
Direction for questions 171 to 175: Answer the questions based on the following information.
The first table gives the percentage of students in MBA class, who sought employment in the areas of finance, marketing and software. The second table gives the average starting salaries of the students per month, (rupees in thousands) in these areas. The third table gives the number of students who passed out in each year.

What is the average monthly salary offered to a management graduate in 1993?

A
Rs. 6,403
B
Rs. 6,330
C
Rs. 6,333
D
Cannot be determined
Solution:
As we don’t have any information about the average monthly salary offered to ‘Others’, we cannot determine the answer.
Q.No: 8
Test Name : CAT Paper 1996
Direction for questions 171 to 175: Answer the questions based on the following information.
The first table gives the percentage of students in MBA class, who sought employment in the areas of finance, marketing and software. The second table gives the average starting salaries of the students per month, (rupees in thousands) in these areas. The third table gives the number of students who passed out in each year.

In 1994, students seeking jobs in finance earned ___ more than those opting for software (per annum).

A
Rs. 43 lakh
B
Rs. 33.8 lakh
C
Rs. 28.4 lakh
D
Rs. 38.8 lakh
Solution:
Q.No: 9
Test Name : CAT Paper 2003 (R)
Directions for questions 120 to 123: Answer the questions on the basis of the following charts.

The profitability of a company is defined as the ratio of its operating profit to its operating income, typically expressed in percentage. The following two charts show the operating income as well as the profitability of six companies in the financial years (F.Ys.) 2001-02 and 2002-03.

Which of the following statements is NOT true?

A
The company with the third lowest profitability in F.Y. 2001-02 has the lowest operating income in F.Y. 2002-03.
B
The company with the highest operating income in the two financial years combined has the lowest operating profit in F.Y. 2002-03.
C
Companies with a higher operating income in F.Y. 2001-02 than in F.Y. 2002-03 have higher profitability in F.Y 2002-03 than in F.Y. 2001-02.
D
Companies with profitability between 10% and 20% in F.Y. 2001-02 also have operating incomes between 150 crore and 200 crore in F.Y. 2002-03.
Solution:
Q.No: 10
Test Name : CAT Paper 2003 (R)
Directions for questions 120 to 123: Answer the questions on the basis of the following charts.

The profitability of a company is defined as the ratio of its operating profit to its operating income, typically expressed in percentage. The following two charts show the operating income as well as the profitability of six companies in the financial years (F.Ys.) 2001-02 and 2002-03.

Which company recorded the highest operating profit in F.Y. 2002-03?

A
A
B
C
C
E
D
F
Solution:
Q.No: 11
Test Name : CAT Paper 2003 (R)
Directions for questions 120 to 123: Answer the questions on the basis of the following charts.

The profitability of a company is defined as the ratio of its operating profit to its operating income, typically expressed in percentage. The following two charts show the operating income as well as the profitability of six companies in the financial years (F.Ys.) 2001-02 and 2002-03.

What is the approximate average operating profit, in F.Y 2001-02, of the two companies excluded from the third chart?

A
–7.5 crore
B
3.5 crore
C
25 crore
D
Cannot be determined
Solution:
Q.No: 12
Test Name : CAT Paper 2003 (R)
Directions for questions 120 to 123: Answer the questions on the basis of the following charts.

The profitability of a company is defined as the ratio of its operating profit to its operating income, typically expressed in percentage. The following two charts show the operating income as well as the profitability of six companies in the financial years (F.Ys.) 2001-02 and 2002-03.

The average operating profit in F.Y. 2002-03 of companies with profitability exceeding 10% in F.Y. 2002-03, is approximately

A
17.5 crore
B
25 crore
C
27.5 crore
D
32.5 crore
Solution:
Q.No: 13
Test Name : CAT Paper 1990
Q101-104 : The following graph shows the value of liquor supplied by the 5 states in 1996 and the excise duty rates in each state.


What is the lowest percentage difference in the excise duty rates for any two states?

A
12
B
15
C
20
D
Cannot be determined.
Solution:
The answer cannot be determined as the data for only five states is given and we don’t know the excise duty rates for other states.
Q.No: 14
Test Name : CAT Paper 1990
Q101-104 : The following graph shows the value of liquor supplied by the 5 states in 1996 and the excise duty rates in each state.


Which of the five states manufactured liquor at the lowest cost?

A
Tamil Nadu
B
Delhi
C
The states which has the lowest value for (wholesale price-Excise duty) per litre
D
Cannot be determined.
Solution:
We have been given the total value in the graph, but nothing is mentioned about the amount of liquor manufactured by states other than Tamil Nadu.
Q.No: 15
Test Name : CAT Paper 1990
Q101-104 : The following graph shows the value of liquor supplied by the 5 states in 1996 and the excise duty rates in each state.


If Excise duty is levied before the goods leave the factory (on the value of the liquor), then which of the following choices shows distilleries in ascending order of the excise duty paid by them for the year 1996? (Assume the total liquor in TN is supplied by only these 5 distilleries).

A
ECABD
B
ADEBC
C
DCEBA
D
Cannot be determined.
Solution:
Since Excise duty is levied on the total value of liquor produced by the 5 distilleries, this will be in the same order as the order of the amount of the liquor produced by them (as the excise duty rate remains constant).
Hence the correct order is DCEBA.
Q.No: 16
Test Name : CAT Paper 1990
Q101-104 : The following graph shows the value of liquor supplied by the 5 states in 1996 and the excise duty rates in each state.


If the Tamil Nadu distillery, with the least average simple annual growth in amount of liquor supplied in the given period had shown the same rate of growth as the one which grew fastest, what would that company’s supply have been in 1998, in lakh liters?

A
13
B
15.11
C
130
D
Cannot be determined.
Solution:
Solution:


Solution:


Solution:


Solution:


Solution:


Solution:


Solution:
As we don’t have any information about the average monthly salary offered to ‘Others’, we cannot determine the answer.


Solution:


Solution:


Solution:


Solution:


Solution:


Solution:
The answer cannot be determined as the data for only five states is given and we don’t know the excise duty rates for other states.


Solution:
We have been given the total value in the graph, but nothing is mentioned about the amount of liquor manufactured by states other than Tamil Nadu.


Solution:
Since Excise duty is levied on the total value of liquor produced by the 5 distilleries, this will be in the same order as the order of the amount of the liquor produced by them (as the excise duty rate remains constant).
Hence the correct order is DCEBA.


Solution:


© 2025 CL Educate Ltd. All rights reserved.