Directions for questions 61 to 64: Answer the questions on the basis of the information given below:
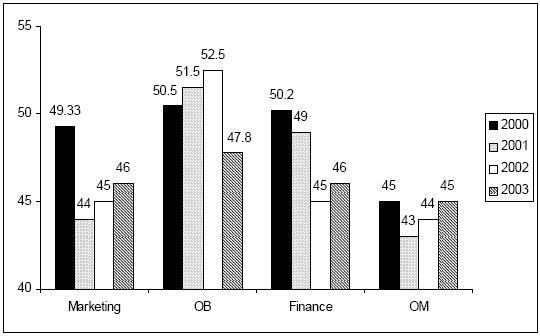
A management institute was established on January 1, 2000 with 3, 4, 5, and 6 faculty members in the Marketing, Organisational Behaviour (OB), Finance, and Operations Management (OM) areas respectively, to start with. No faculty member retired or joined the institute in the first three months of the year 2000. In the next four years, the institute recruited one faculty member in each of the four areas. All these new faculty members, who joined the institute subsequently over the years, were 25 years old at the time of their joining the institute. All of them joined the institute on April 1. During these four years, one of the faculty members retired at the age of 60. The following diagram gives the area-wise average age (in terms of number of completed years) of faculty members as on April 1 of 2000, 2001, 2002, and 2003.
Professors Naresh and Devesh, two faculty members in the Marketing area, who have been with the Institute since its inception, share a birthday, which falls on 20th November. One was born in 1947 and the other one in 1950. On April 1 2005, what was the age of the third faculty member, who has been in the same area since inception?