Back Home
Persistent Timer

Bar Graph (Logic Based)

Q.No: 1
Test Name : CAT 2018 Actual Paper Slot 2
Directions for questions 63 to 66: Each of the 23 boxes in the picture below represents a product manufactured by one of the following three companies: Alfa, Bravo and Charlie. The area of a box is proportional to the revenue from the corresponding product, while its centre represents the Product popularity and Market potential scores of the product (out of 20). The shadings of some of the boxes have got erased.
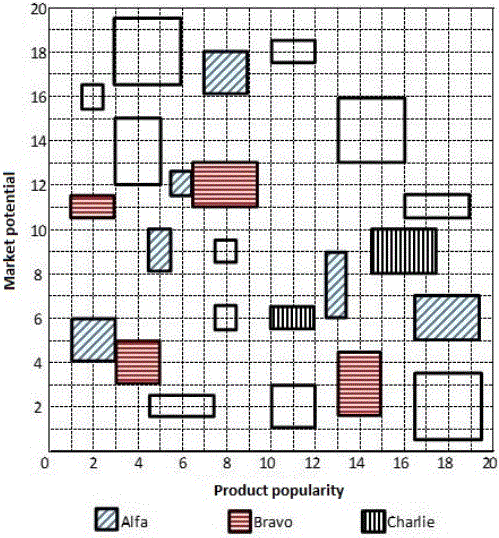


The companies classified their products into four categories based on a combination of scores (out of 20) on the two parameters – Product popularity and Market potential as given below:


The following facts are known:

1. Alfa and Bravo had the same number of products in the Blockbuster category.
2. Charlie had more products than Bravo but fewer products than Alfa in the No-hope category.
3. Each company had an equal number of products in the Promising category.
4. Charlie did not have any product in the Doubtful category, while Alfa had one product more than Bravo in this category.
5. Bravo had a higher revenue than Alfa from products in the Doubtful category.
6. Charlie had a higher revenue than Bravo from products in the Blockbuster category.
7. Bravo and Charlie had the same revenue from products in the No-hope category.
8. Alfa and Charlie had the same total revenue considering all products.

Considering all companies' products, which product category had the highest revenue?

A
Promising
B
Blockbuster
C
Doubtful
D
No-hope
Solution:
Q.No: 2
Test Name : CAT 2018 Actual Paper Slot 2
Directions for questions 63 to 66: Each of the 23 boxes in the picture below represents a product manufactured by one of the following three companies: Alfa, Bravo and Charlie. The area of a box is proportional to the revenue from the corresponding product, while its centre represents the Product popularity and Market potential scores of the product (out of 20). The shadings of some of the boxes have got erased.


The companies classified their products into four categories based on a combination of scores (out of 20) on the two parameters – Product popularity and Market potential as given below:


The following facts are known:

1. Alfa and Bravo had the same number of products in the Blockbuster category.
2. Charlie had more products than Bravo but fewer products than Alfa in the No-hope category.
3. Each company had an equal number of products in the Promising category.
4. Charlie did not have any product in the Doubtful category, while Alfa had one product more than Bravo in this category.
5. Bravo had a higher revenue than Alfa from products in the Doubtful category.
6. Charlie had a higher revenue than Bravo from products in the Blockbuster category.
7. Bravo and Charlie had the same revenue from products in the No-hope category.
8. Alfa and Charlie had the same total revenue considering all products.

Which of the following is the correct sequence of numbers of products Bravo had in No-hope, Doubtful, Promising and Blockbuster categories respectively?

A
1,3,1,2
B
1,3,1,3
C
3,3,1,2
D
2,3,1,2
Solution:
Q.No: 3
Test Name : CAT 2018 Actual Paper Slot 2
Directions for questions 63 to 66: Each of the 23 boxes in the picture below represents a product manufactured by one of the following three companies: Alfa, Bravo and Charlie. The area of a box is proportional to the revenue from the corresponding product, while its centre represents the Product popularity and Market potential scores of the product (out of 20). The shadings of some of the boxes have got erased.


The companies classified their products into four categories based on a combination of scores (out of 20) on the two parameters – Product popularity and Market potential as given below:


The following facts are known:

1. Alfa and Bravo had the same number of products in the Blockbuster category.
2. Charlie had more products than Bravo but fewer products than Alfa in the No-hope category.
3. Each company had an equal number of products in the Promising category.
4. Charlie did not have any product in the Doubtful category, while Alfa had one product more than Bravo in this category.
5. Bravo had a higher revenue than Alfa from products in the Doubtful category.
6. Charlie had a higher revenue than Bravo from products in the Blockbuster category.
7. Bravo and Charlie had the same revenue from products in the No-hope category.
8. Alfa and Charlie had the same total revenue considering all products.

Which of the following statements is NOT correct?

A
Bravo and Charlie had the same revenues from No-hope products
B
The total revenue from No-hope products was less than the total revenue from Doubtful products
C
Alfa's revenue from Blockbuster products was the same as Charlie's revenue from Promising products
D
Bravo's revenue from Blockbuster products was greater than Alfa's revenue from Doubtful products
Solution:
Q.No: 4
Test Name : CAT 2018 Actual Paper Slot 2
Directions for questions 63 to 66: Each of the 23 boxes in the picture below represents a product manufactured by one of the following three companies: Alfa, Bravo and Charlie. The area of a box is proportional to the revenue from the corresponding product, while its centre represents the Product popularity and Market potential scores of the product (out of 20). The shadings of some of the boxes have got erased.


The companies classified their products into four categories based on a combination of scores (out of 20) on the two parameters – Product popularity and Market potential as given below:


The following facts are known:

1. Alfa and Bravo had the same number of products in the Blockbuster category.
2. Charlie had more products than Bravo but fewer products than Alfa in the No-hope category.
3. Each company had an equal number of products in the Promising category.
4. Charlie did not have any product in the Doubtful category, while Alfa had one product more than Bravo in this category.
5. Bravo had a higher revenue than Alfa from products in the Doubtful category.
6. Charlie had a higher revenue than Bravo from products in the Blockbuster category.
7. Bravo and Charlie had the same revenue from products in the No-hope category.
8. Alfa and Charlie had the same total revenue considering all products.

If the smallest box on the grid is equivalent to revenue of Rs.1 crore, then what approximately was the total revenue of Bravo in Rs. crore?

A
34
B
40
C
30
D
24
Solution:
Q.No: 5
Test Name : CAT Actual Paper 2021 Slot-2


The different bars in the diagram above provide information about different orders invarious categories (Art, Binders, ….) that were booked in the first two weeks of Septemberof a store for one client. The colour and pattern of a bar denotes the ship mode (First Class/ Second Class / Standard Class). The left end point of a bar indicates the booking day ofthe order, while the right end point indicates the dispatch day of the order. The differencebetween the dispatch day and the booking day (measured in terms of the number of days)is called the processing time of the order. For the same category, an order is consideredfor booking only after the previous order of the same category is dispatched. No twoconsecutive orders of the same category had identical ship mode during this period.

For example, there were only two orders in the furnishing category during this period. Thefirst one was shipped in the Second Class. It was booked on Sep 1 and dispatched on Sep5. The second order was shipped in the Standard class. It was booked on Sep 5 (althoughthe order might have been placed before that) and dispatched on Sep 12. So theprocessing times were 4 and 7 days respectively for these orders.

How many days between Sep 1 and Sep 14 (both inclusive) had no booking fromthis client considering all the above categories?

Solution:
Q.No: 6
Test Name : CAT Actual Paper 2021 Slot-2


The different bars in the diagram above provide information about different orders invarious categories (Art, Binders, ….) that were booked in the first two weeks of Septemberof a store for one client. The colour and pattern of a bar denotes the ship mode (First Class/ Second Class / Standard Class). The left end point of a bar indicates the booking day ofthe order, while the right end point indicates the dispatch day of the order. The differencebetween the dispatch day and the booking day (measured in terms of the number of days)is called the processing time of the order. For the same category, an order is consideredfor booking only after the previous order of the same category is dispatched. No twoconsecutive orders of the same category had identical ship mode during this period.

For example, there were only two orders in the furnishing category during this period. Thefirst one was shipped in the Second Class. It was booked on Sep 1 and dispatched on Sep5. The second order was shipped in the Standard class. It was booked on Sep 5 (althoughthe order might have been placed before that) and dispatched on Sep 12. So theprocessing times were 4 and 7 days respectively for these orders.

What was the average processing time of all orders in the categories which hadonly one type of ship mode?

Solution:
Q.No: 7
Test Name : CAT Actual Paper 2021 Slot-2


The different bars in the diagram above provide information about different orders invarious categories (Art, Binders, ….) that were booked in the first two weeks of Septemberof a store for one client. The colour and pattern of a bar denotes the ship mode (First Class/ Second Class / Standard Class). The left end point of a bar indicates the booking day ofthe order, while the right end point indicates the dispatch day of the order. The differencebetween the dispatch day and the booking day (measured in terms of the number of days)is called the processing time of the order. For the same category, an order is consideredfor booking only after the previous order of the same category is dispatched. No twoconsecutive orders of the same category had identical ship mode during this period.

For example, there were only two orders in the furnishing category during this period. Thefirst one was shipped in the Second Class. It was booked on Sep 1 and dispatched on Sep5. The second order was shipped in the Standard class. It was booked on Sep 5 (althoughthe order might have been placed before that) and dispatched on Sep 12. So theprocessing times were 4 and 7 days respectively for these orders.

The sequence of categories -- Art, Binders, Paper and Phones -- in decreasing order ofaverage processing time of their orders in this period is:

A
Phones, Binders, Art, Paper
B
Phones, Art, Binders, Paper
C
Art, Binders, Paper, Phones
D
Paper, Binders, Art, Phones
Solution:
Q.No: 8
Test Name : CAT Actual Paper 2021 Slot-2


The different bars in the diagram above provide information about different orders invarious categories (Art, Binders, ….) that were booked in the first two weeks of Septemberof a store for one client. The colour and pattern of a bar denotes the ship mode (First Class/ Second Class / Standard Class). The left end point of a bar indicates the booking day ofthe order, while the right end point indicates the dispatch day of the order. The differencebetween the dispatch day and the booking day (measured in terms of the number of days)is called the processing time of the order. For the same category, an order is consideredfor booking only after the previous order of the same category is dispatched. No twoconsecutive orders of the same category had identical ship mode during this period.

For example, there were only two orders in the furnishing category during this period. Thefirst one was shipped in the Second Class. It was booked on Sep 1 and dispatched on Sep5. The second order was shipped in the Standard class. It was booked on Sep 5 (althoughthe order might have been placed before that) and dispatched on Sep 12. So theprocessing times were 4 and 7 days respectively for these orders.

Approximately what percentage of orders had a processing time of one day during theperiod Sep 1 to Sep 22 (both dates inclusive)?

A
20%
B
22%
C
16%
D
25%
Solution:
Q.No: 9
Test Name : CAT Actual Paper 2021 Slot-3


The figure above shows the schedule of four employees – Abani, Bahni, Danni and Tinni – whom Dhoni supervised in 2020. Altogether there were five projects which started and concluded in 2020 in which they were involved. For each of these projects and for each employee, the starting day was at the beginning of a month and the concluding day was the end of a month, and these are indicated by the left and right end points of the corresponding horizontal bars. The number within each bar indicates the percentage of assigned work completed by the employee for that project, as assessed by Dhoni.

For each employee, his/her total project-month (in 2020) is the sum of the number of months (s)he worked across the five project, while his/her annual completion index is the weightage average of the completion percentage assigned from the different projects, with the weights being the corresponding number of months (s)he worked in these projects. For each project, the total employee-month is the sum of the number of months four employees worked in this project, while its completion index is the weightage average of the completion percentage assigned for the employees who worked in this project, with the weights being the corresponding number of months they worked in this project.

Which of the following statements is/are true?

I: The total project-month was the same for the four employees.
II: The total employee-month was the same for the five projects.

A
Only II
B
Neither I nor II
C
Both I and II
D
Only I
Solution:
Q.No: 10
Test Name : CAT Actual Paper 2021 Slot-3


The figure above shows the schedule of four employees – Abani, Bahni, Danni and Tinni – whom Dhoni supervised in 2020. Altogether there were five projects which started and concluded in 2020 in which they were involved. For each of these projects and for each employee, the starting day was at the beginning of a month and the concluding day was the end of a month, and these are indicated by the left and right end points of the corresponding horizontal bars. The number within each bar indicates the percentage of assigned work completed by the employee for that project, as assessed by Dhoni.

For each employee, his/her total project-month (in 2020) is the sum of the number of months (s)he worked across the five project, while his/her annual completion index is the weightage average of the completion percentage assigned from the different projects, with the weights being the corresponding number of months (s)he worked in these projects. For each project, the total employee-month is the sum of the number of months four employees worked in this project, while its completion index is the weightage average of the completion percentage assigned for the employees who worked in this project, with the weights being the corresponding number of months they worked in this project.

Which employees did not work in multiple projects for any of the months in 2020

A
All four of them
B
Only Tinni
C
Only Abani and Bahni
D
Only Abani, Bahni and Danni
Solution:
Q.No: 11
Test Name : CAT Actual Paper 2021 Slot-3


The figure above shows the schedule of four employees – Abani, Bahni, Danni and Tinni – whom Dhoni supervised in 2020. Altogether there were five projects which started and concluded in 2020 in which they were involved. For each of these projects and for each employee, the starting day was at the beginning of a month and the concluding day was the end of a month, and these are indicated by the left and right end points of the corresponding horizontal bars. The number within each bar indicates the percentage of assigned work completed by the employee for that project, as assessed by Dhoni.

For each employee, his/her total project-month (in 2020) is the sum of the number of months (s)he worked across the five project, while his/her annual completion index is the weightage average of the completion percentage assigned from the different projects, with the weights being the corresponding number of months (s)he worked in these projects. For each project, the total employee-month is the sum of the number of months four employees worked in this project, while its completion index is the weightage average of the completion percentage assigned for the employees who worked in this project, with the weights being the corresponding number of months they worked in this project.

The project duration, measured in terms of the number of months, is the time during which at least one employee worked in the project. Which of the following pairs of the projects had the same duration?

A
Project 3, Project 5
B
Project 1, Project 5
C
Project 4, Project 5
D
Project 3, Project 4
Solution:
Q.No: 12
Test Name : CAT Actual Paper 2021 Slot-3


The figure above shows the schedule of four employees – Abani, Bahni, Danni and Tinni – whom Dhoni supervised in 2020. Altogether there were five projects which started and concluded in 2020 in which they were involved. For each of these projects and for each employee, the starting day was at the beginning of a month and the concluding day was the end of a month, and these are indicated by the left and right end points of the corresponding horizontal bars. The number within each bar indicates the percentage of assigned work completed by the employee for that project, as assessed by Dhoni.

For each employee, his/her total project-month (in 2020) is the sum of the number of months (s)he worked across the five project, while his/her annual completion index is the weightage average of the completion percentage assigned from the different projects, with the weights being the corresponding number of months (s)he worked in these projects. For each project, the total employee-month is the sum of the number of months four employees worked in this project, while its completion index is the weightage average of the completion percentage assigned for the employees who worked in this project, with the weights being the corresponding number of months they worked in this project.

The list of employees in decreasing order of annual completion index is:

A
Danni, Tinni, Abani, Bahni
B
Tinni, Danni, Abani, Bahni
C
Bahni, Abani, Tinni, Danni
D
Danni, Tinni, Bahni, Abani
Solution:
Solution:


Solution:


Solution:


Solution:


Solution:


Solution:


Solution:


Solution:


Solution:


Solution:


Solution:


Solution:


© 2025 CL Educate Ltd. All rights reserved.