Directions for questions 128 to 130: Answer the questions based on the pie charts given below.
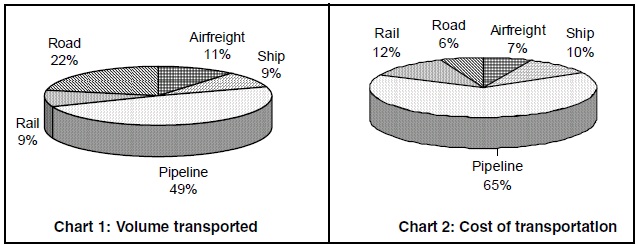
Chart 1 shows the distribution of 12 million tonnes of crude oil transported through different modes over a
specific period of time.
Chart 2 shows the distribution of the cost of transporting this crude oil. The total
cost was Rs. 30 million.
If the costs per tonne of transport by ship, air and road are represented by P, Q and R respectively,
which of the following is true?