Statistics-NCERT Solutions


Class X Math
NCERT Solution for Statistics
NCERT Solution for Statistics
EXERCISE : 14.1
1. A survey was conducted by a group of students as a part of their environment awareness programme, in which they collected the following data regarding the number of plants in 20 houses in a locality. Find the mean number of plants per house.

Which method did you use for finding the mean, and why?
Sol. We can calculate the mean as:

Thus, mean number of plants per house is 8.1.
Since, values of xi and fi are small
2. Consider the following distribution of daily wages of 50 workers of a factory.
Find the mean daily wages of the workers of the factory by using an appropriate method.
Sol. Let the assumed mean, a = 150

Now 
= 145.2
3. The following distribution shows the daily pocket allowance of children of a locality. The mean pocket allowance is Rs. 18. Find the missing frequency f.
Sol. Let the assumed mean, a = 16
Now, we have the following table:

Since  a = 16 and h = 2
Thus, the missing frequency is 20.
4. Thirty women were examined in a hospital by a doctor and the number of heart beats per minute were recorded and summarised as follows. Find the mean heart beats per minute for these women, choosing a suitable method.

Sol. Let the assumed mean a = 75.5
Now, we have the following table:
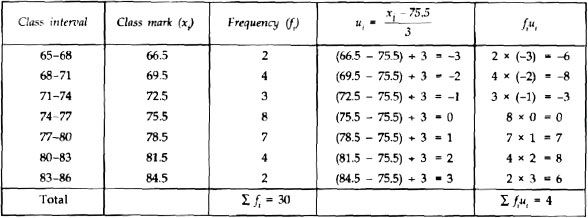
Thus, the mean heart beat per minute is 75.9.
5. In a retail market, fruit vendors were selling mangoes kept in packing boxes. These boxes contained carying number of mangoes. The following was the distribution of mangoes according to the number
Find the mean number of mangoes kept in a packing box. Which of finding the mean did you choose?
Sol. Let the assumed mean a = 60
Here, class interval h = 3
Now, we have the following table:

= 57.19 (approx).
Thus, the average number of mangoes per box = 57.19.
6. The table below shows the daily expenditure on food of 25 households in a locality.

Find the mean daily expenditure on food by a suitable method.
Sol. let the assumed mean, a = 225
And class interval h = 50

= 211
Thus, the mean daily expenditure of food is Rs. 211.
7. To find out the concentration of SO2 in the air (in parts per million, i.e., ppm), the data was collected for 30 localities in a certain city and is presented below:

Find the mean concentration of SO2 in the air.
Sol. Let the assumed mean a = 0.14
Here, class interval h = 0.04

Thus, mean concentration of SO2 in air is 0.099 ppm.
8. A class teacher has the following absentee record of 40 students of a class for the whole term. Find the mean number of days a student was absent.
Sol. Using the direct method, we have the following table:

Thus, mean number of days a student remaind absent = 12.47. (Approx.)
9. The following table gives the literacy rate (in percentage) of 35 cities. Find the mean literacy rate.
Sol. Let assumed mean a = 70
Now, we have the following table:


= 69.43% (approx.)
Thus, the mean literacy rate is 69.43%.
Exercise 14.2
1. The following table shows the ages of the patients admitted in a hospital during a year:
Find the mode and the mean of the data given above. Compare and interpret the two measures of central tendency.
Sol. Mode:
Here, the highest frequency is 23.
The frequency 23 corresponds to the class interval 35 – 45.
Now, Class size (h) = 10
Lower limit (l) = 35
Frequency of the modal class (f1) = 23
Frequency of the class preceding the modal class
f0 = 21
Frequency of the class succeeding the modal class
f2 = 14
= 36.8 years (approx.)
Mean
Let assumed mean a = 40

2. The following data gives the information on the observed lifetimes (in hours) of 225 electrical components:
Determine the modal lifetimes of the components.
Sol. Here, the highest frequency = 61.
h = 20
f1 = 61
f0 = 52
f2 = 38
= 65.625 hours.
Thus, the required modal life times of the components is 65.625 hours.
3. The following data gives the distribution of total monthly household expenditure of 200 families of a village. Find the modal monthly ependiture of the families. Also, the mean monthly expenditure:

Sol. Mode:
I = 1500, h = 500
f1 = 40, f0 = 24
f2 = 33
Thus, the required modal monthly expenditure of the families is Rs. 1847.83.
Mean: Let assumed mean (a) = 3250

= 2662.5
Thus, the mean monthly expenditure = Rs. 2662.50.
4. The following distribution gives the state-wise teacher-student ratio in higher secondary schools of India. Find the mode and mean of this data. Interpret the two measures.

Sol. Mode:
Since the class 30 – 35 has the greatest frequency and h = 5
l = 30
f1 = 10
f0 = 9
f2 = 3
= 30 + 0.625 = 30.6 (approx).
Mean:
Let the assumed mean (a) = 37.5
Since, h = 5

5. The given distribution shows the number of runs scored by some top batsmen of the world in one-day international cricket matches.

Find the mode of the data.
Sol. The class 4000–5000 has the highest frequency i.e., 18
l = 4000
f1 = 18
f0 = 4
f2 = 9
Now, Mode = 
= 4000 + 608.695
= 4608.7 (approx.)
Thus, the required mode is 4608.7.
6. A student noted the number of cars passing through a spot on a road for 100 periods each of 3 minutes and summarised it in the table given below. Find the mode of the data:
Sol.  The class 40 – 50 has the maximum frequency i.e., 20
Also l = 40
= 40 + 4.7 = 44.7
Thus, the required mode is 44.7.
EXERCISE : 14.3
1. The following frequency distribution gives the monthly consumption of electricity of 68 consumers of a locality. Find the median, mean and mode of the data and compare them.

Sol. Median
Let us prepare a cumulative frequency table:

Now, we have n = 68 
f = 20 and h = 20
Using the formula,
Median = 
= 125 + 12 = 137 units.
Mean
Assumed mean (a) = 135
Now, we have the following table:

= 137.05 units.
Mode
We have:
h = 20
l = 125
f1 = 20
f0 = 13
f2 = 14
We observe that the three measures are approximately equal in this case.
2. If the median of the distribution given below is 28.5, find the values of x and y.

Sol. Here, we have n = 60 
Now, cumulative frequency table is:

Since, median = 28.5
We have: l = 20
h = 10
f = 20
cf = 5 + x
Median = 

Also 45 + x + y = 60
Thus, x = 8
y = 7
3. A life insurance agent found the following data for distribution of ages of 100 policy holders. Calculate the median age, if policies are given only to persons having age 18 years onwards but less than 60 years.

Sol. The given table is cumulative frequency distribution. We write the frequency distribution as given below:

We have 
Now, 
Now, Median = 
Median = 35 + 
Thus, the median age = 35.76 years.
4. The lengths of 40 leaves of a plant are measured correct to the nearest millimetre, and the data obtained is represented in the following table:

Find the median length of the leaves.
[Hint: The data needs to be converted to continuous classes for finding the median, since the formula assumes continuous classes. The class then change to 117.5–126.5, 126.5–135.5, ..., 171.5–180.5.]
Sol. After changing the given table as continuous classes we prepare the cumulative frequency table:

Now, 
The cumulative frequency just above  i.e., 20 is 29 and it corresponds to the class 144.5–153.5.
So, 144.5–153.5 is the median class.
We have:
and h = 9
Median = 
= 146.75 mm.
5. The following table gives the distribution of the life time of 400 neon lamps:

Find the median life time of a lamp.
Sol. To compute the median, let us write the cumulative frequency distribution as given below:

We have 
Since, the cumulative frequency just greater than i.e., greater than 200 is 216.
and 
Now, Median = 
Thus, median life = 3406.98 hours.
6. 100 surnames were randomly picked up from a local telephone directory and the frequency distribution of the number of letters in the English alphabets in the surnames was obtained as follows:
Determine the median number of letters in the surnames. Find the mean number of letters in the surnames? Also, find the modal size of the surnames.
Sol. Median

Since, the cumulative frequency just greater than i.e., greater than 50 is 76.
We have 
l = 7
cf = 36
f = 40
and h = 3
= 7 + 1.05 = 8.05

Mode
Since the class 7 – 10 has the maximum frequency.
So, we have
l = 7, h = 3
f1 = 40
f0 = 30
f2 = 16
= 7.88
Thus, the required
Median = 8.05, Mean = 8.32 and Mode = 7.88.
7. The distribution below gives the weights of 30 students of a class. Find the median weight of the students.
Sol. We have

The cumulative frequency just more than  i.e., more than 15 is 19, which corresponds to the class 55–60.
l = 15
f = 6
cf = 13 and h = 5
Thus, the required median weight = 56.67 kg.
EXERCISE : 14.4
1. The following distribution gives the daily income of 50 workers of a factory.
Convert the distribution above to a less than type cumulative frequency distribution, and draw its ogive.
Sol. We have the cumulative frequency distribution as:

Now, we plot the points corresponding to the ordered pairs (120, 12), (140, 26), (160, 34), (180, 40) and (200, 50) on a graph paper and join them by a free hand smooth curve as shown below:

The curve so obtained is called the less than ogive.
2. During the medical check-up of 35 students of a class, their wrights were recorded as follows:

Draw a less than type ogive for the given data. Hence obtain the median weight from the graph and verify the result by using the formula.
Sol. Here, the values 38, 40, 42, 44, 46, 48, 50 and 52 are the upper limits of the respective class-intervals.
We plot the points (ordered pairs) (38, 0), (40, 3), (42, 5), (44, 9), (46, 14), (48, 28), (50, 32) and (52, 35) on a graph paper and join them by a free hand smooth curve.
The curve so obtained is the less than type ogive.

From the point (i.e., from 17.5) we draw a line parallel to the x-axis which cuts the curve at P. From this point (i.e., from P), draw a perpendicular to the x-axis, meeting the x-axis at Q. The point Q represents the median of the data which is 47.5.
Verfication
To verify the result using the formula, let us make the following table in order to find median using the formula:

Here, 
Since, the observation lies in the class 46 – 48.
l = 46, h = 2, f = 14, cf = 14
= 46.5
Thus, the median = 46.5 kg is approximately verified.
3. The following table gives production yield per hectare of wheat of 100 farms of a village.

Change the distribution to a more than type distribution, and draw its ogive.
Sol. For `more than type' distribution, we have:

Now, we plot the points (50, 100), (55, 98), (60, 90), (65, 78), (70, 54) and (75, 16) and join the point with a free hand curve.

The curve so obtained is the `more than type ogive'.