CAT Score vs Percentile 2025 - Section-wise & Slot-wise CAT Scores
The CAT 2025 marks vs percentile relationship will help you determine the approximate score neded for the CAT 2026 and also target the right score for your B-school goals. This table lists the estimated overall CAT score required to reach each percentile in each slot.
|
Slot-wise CAT scores VS Percentile 2025 |
|||||
|
CAT Percentile |
Slot 1 |
Slot 2 |
Slot 3 |
||
|
99 |
81 |
82-83 |
83-84 |
||
|
95 |
65 |
66 |
67 |
||
|
90 |
52 |
53 |
53 |
||
|
85 |
45 |
45 |
45 |
||
|
80 |
40 |
40 |
40 |
||
Section-Wise CAT Score Vs Percentile 2025
VARC Score Vs Percentile 2025
These VARC score ranges show the marks needed in each slot to reach key percentiles in CAT 2025.
|
CAT Percentile |
Slot-1 |
Slot-2 |
Slot 3 |
|
99 |
40 |
40 |
42 |
|
95 |
33 |
33 |
33 |
|
90 |
25 |
25 |
25 |
|
85 |
23 |
23 |
23 |
|
80 |
21 |
21 |
21 |
DILR Marks Vs Percentile 2025
This table highlights the DILR scores required for major percentiles across all slots.
|
CAT Percentile |
Slot-1 |
Slot-2 |
Slot 3 |
|
99 |
26 |
27 |
27 |
|
95 |
19 |
19 |
20 |
|
90 |
16 |
16 |
16 |
|
85 |
13 |
13 |
13 |
|
80 |
12 |
12 |
12 |
QA Score Vs Percentile 2025
These QA score estimates show the marks typically needed for each percentile in Slot 1, Slot 2, and Slot 3.
|
CAT Percentile |
Slot-1 |
Slot-2 |
Slot 3 |
|
99 |
28 |
30 |
28 |
|
95 |
21 |
22 |
22 |
|
90 |
18 |
20 |
20 |
|
85 |
14 |
14 |
14 |
|
80 |
13 |
13 |
13 |
Read about CL's CAT Score Calculator and IIM Profilizer to find out the calls you would receive from IIMs and other B-schools.
From CAT Test Series to 99+ Strategy
Mocks are everywhere. But knowing what to do after the mock is what makes the difference. With Career Launcher’s AI-powered Booster and Drill-Down Analysis, every test tells you more than just your score; it shows where you stand, where you’re losing marks, and what needs to change. Identify your strengths, fix your weak areas, and keep refining your strategy with every attempt as you work towards your 99+ percentile goal.
Enroll in CAT Test Series 2026CAT Score vs Percentile 2026: Key Highlights
- Scoring a 99+ %ile in CAT usually requires a CAT score of roughly 80-90+ marks, but this varies each year based on paper difficulty.
- Sectional balance is important; even high overall scores won’t qualify you for IIMs without clearing each section’s cutoff.
- Slot-wise scaling can lift a difficult paper’s raw scores higher, so focus on accuracy even if a section feels tough.
Looking for top MBA colleges with a CAT score? Check out the extensive list of top MBA B-schools and their expected cut-offs for 2026
CAT Marks Vs Percentile 2026 - What Is Your CAT Score?
The first question most first-time CAT takers ask is, "What exactly are CAT marks and CAT percentile?"
In simple terms, your CAT score represents the marks you obtain in the exam, while your CAT percentile indicates the percentage of candidates you have performed better than.
However, understanding your result becomes clearer when you know how these raw marks are converted into scaled scores and finally into percentiles. So let's break it down.
What is the Raw CAT Score?
Your raw CAT score is the total marks calculated based on the number of correct and incorrect attempts across all sections.
Since CAT is conducted in three slots with varying difficulty levels, raw scores alone cannot ensure fairness. Therefore, CAT uses a Normalization Process to convert raw marks into scaled scores so that all candidates are evaluated on an equal footing.
Your CAT scorecard displays only the scaled scores and percentiles for each section and for the overall exam- raw scores are not shown to candidates.
Want a deeper understanding of how your scores are converted? Check out our complete guide on CAT Scaled Score vs Raw Score.
CAT Marks Vs Percentile - What is CAT Scaled Score?
The CAT scaled score is evaluated based on CAT marks, whereas the CAT Percentile is the total percentage of candidates who secured less than or equal to a specific candidate’s score. This naturally leads to the next big question: how many marks do you actually need in CAT to score 99, 95, or 90 percentile? To understand the targets clearly, check out our detailed guide on the Expected CAT Score for 99,95,90 Percentile.
CAT Score Vs Percentile - What is CAT Percentile?
The CAT percentile represents a candidate's relative performance compared to all other test-takers. It does not reflect the actual marks (raw scores) but instead indicates the percentage of candidates who scored less than or equal to you. In simple terms, if you secure a 95 percentile, it means you performed better than 95% of all CAT aspirants.
The overall percentile is derived from your performance across all three sections:
- Verbal Ability and Reading Comprehension (VARC)
- Data Interpretation and Logical Reasoning (DILR)
- Quantitative Ability (QA)
Each section’s scaled score is first converted into a sectional percentile, and then the overall percentile is computed based on your total scaled score.
Understanding CAT percentiles is crucial because B-schools use them as the primary shortlisting criterion for further admission processes like the WAT (Written Ability Test), PI (Personal Interview), or GD (Group Discussion).
How Is CAT Percentile Calculated?
Step 1: Calculate the total number of candidates (N) who appeared for CAT (i.e. including morning, afternoon and evening sessions).
Step 2: Assign a rank (r) to all candidates who appeared for CAT based on the scaled scores obtained in all the sections. In the case of two or more candidates obtaining identical scaled scores of the particular section, assign identical ranks to all those candidates.
Note: If two or more candidates' scaled scores are the same, they will be given the same rank (r). That is, if two candidates get the highest scaled score in VARC, they will be assigned rank 1. Also, the candidate with the second highest scaled score will follow at rank 3. The Final Percentile (P) will be rounded off to two decimal places.
Step 3: Calculate the percentile score (P) of a candidate with rank (r) of the particular section as:
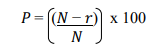
where,
P = Percentile of the candidate
N = Number of candidates who appeared for CAT 2025
r = The rank assigned to candidates based on their scaled scores
Step 4: Round off the calculated percentile score (P) of a candidate up to two decimal points. For example, all percentile scores greater than or equal to 99.995 are rounded off to 100, and all percentile scores greater than or equal to 99.985 but strictly less than 99.995 are rounded off to 99.99 and so on.
A similar methodology is used to compute the overall CAT percentile scores and the percentile scores of other sections.
What Is Considered A Good CAT Score?
There is no specific answer to this question, as it is subject to the candidate's interests and the college they are aiming to get into. However, ideally, students should target a CAT percentile above 95% to secure a seat in some of the best MBA colleges in India. The table below represents the good CAT scores that have a high chance of achieving a good percentile in CAT 2026.
|
Category |
CAT Score Range |
|
Very Good |
80-90 |
|
Good |
65-79 |
|
Average |
41-64 |
|
Low |
Below 40 |
These values are indicative and based on CAT 2025 trends. Actual score-percentile mapping may vary with exam difficulty and slot-wise normalisation.
A clear understanding of what score aligns with your target percentile will help you plan better and set realistic goals for improvement.
Also check out what is a good percentile in 2026 to know more about a good CAT score.
How Is CAT Composite Score Considered For Determining CAT Marks Vs Percentile?
There are several parameters based on which B-schools determine a candidate’s composite score for shortlisting after the CAT exam. While the CAT percentile reflects the percentage of candidates you’ve outperformed based on your scaled score, the composite score used for admissions considers additional factors such as:
- CAT 2025 Scaled Score
- 10th, 12th, and Graduation Marks
- Gender Diversity
- Academic Diversity
- Work Experience (if any)
Each IIM and participating B-school assigns different weightages to these components. Some institutes emphasise past academics more, while others focus on recent performance or overall profile strength.
CAT Score Vs Percentile: Past Year Trends
The CAT exam's past year's trends would help the aspirants understand the difficulty level of the exam and analyse the percentile and score for the year 2025. Studying past CAT score vs percentile data enables candidates to evaluate difficulty levels, identify competition trends, and establish achievable goals.
CAT Score Vs Percentile Trend 2024 Analysis
Aspirants should understand that MBA admissions through the CAT exam rely on percentiles rather than raw scores. This means that they need to perform well and also outperform other test takers. The table below shows the slot-wise distribution of CAT scores vs percentile for 2024, to give a fair idea of expectations for future CAT scores.
|
CAT Score Vs Percentile 2024 Slot-wise Trends |
|||
|
CAT Percentile |
CAT 2024 - SLOT 3 |
CAT 2024 - SLOT 2 |
CAT 2024 - SLOT 1 |
|
99 |
90-92 |
87-89 |
90-92 |
|
95 |
68-70 |
65-67 |
68-70 |
|
90 |
56-58 |
53-55 |
56-58 |
|
85 |
47-49 |
44-46 |
47-49 |
|
80 |
41-43 |
38-40 |
41-43 |
*The data has been collected by our CAT students and is subject to change based on the number of responses collected on our CAT Score Calculator.
|
CAT Score Vs Percentile 2024 overall Trends |
|
|
Percentile |
Approximate Marks in 2024 |
|
99.5 |
140 |
|
99 |
103 |
|
95 |
58 |
|
90 |
47 |
|
85 |
44 |
|
80 |
43 |
CAT Score Vs Percentile 2023 - Complete Analysis
|
Expected Percentiles |
VARC Score |
DILR Score |
QA Score |
Overall Score |
||||||||
|
Slot 1 |
Slot 2 |
Slot 3 |
Slot 1 |
Slot 2 |
Slot 3 |
Slot 1 |
Slot 2 |
Slot 3 |
Slot 1 |
Slot 2 |
Slot 3 |
|
|
99 |
40 |
40-42 |
38-40 |
25-27 |
25-26 |
27-28 |
25-28 |
28-30 |
27-28 |
80-81 |
82-83 |
78-80 |
|
95 |
28-30 |
30-33 |
28-30 |
18-20 |
18-20 |
18-20 |
20-22 |
20-22 |
18-20 |
55-56 |
57-58 |
57-58 |
|
90 |
22-24 |
24-26 |
24-25 |
15-17 |
14-15 |
15-17 |
15-17 |
15-17 |
15-17 |
45-48 |
46-48 |
46-48 |
|
85 |
20-22 |
20-22 |
20-22 |
13-14 |
12-13 |
12-14 |
12-14 |
12-14 |
12-14 |
39-41 |
40-43 |
40-41 |
|
80 |
18-20 |
18-20 |
18-20 |
11-12 |
10-11 |
10-11 |
10-12 |
10-12 |
10-11 |
35-37 |
36-39 |
36-37 |
*Fill in the score calculator to determine your overall score and predicted percentile using Career Launcher’s Percentile Predictor. Take advantage of our resources to stay one step ahead of your competition.
CAT Marks Vs Percentile Trend 2022 Analysis
|
Percentile |
Approximate Marks in 2022 |
|
99.5 |
145.83 |
|
99 |
109.9 |
|
95 |
59.75 |
|
90 |
48.44 |
|
85 |
41.32 |
|
80 |
36.02 |